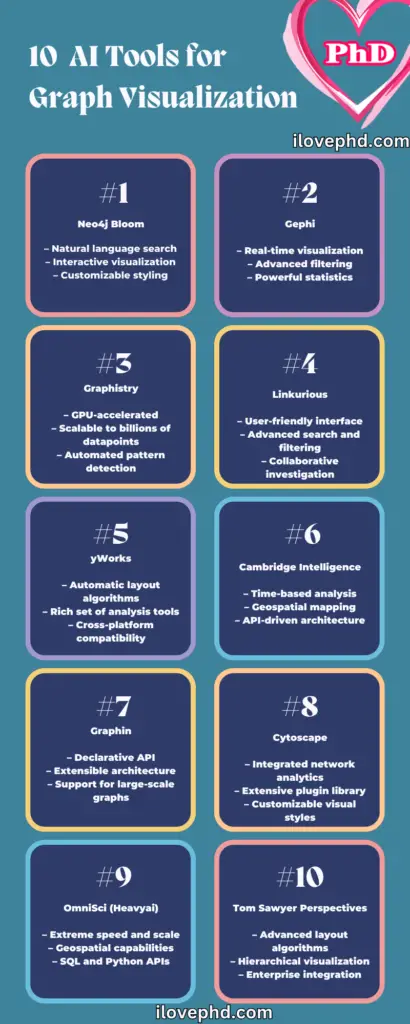
Are you ready to transform your data into stunning, interactive visuals? Dive into the world of AI-powered graph visualization and unlock insights you never knew existed. In this article, we’ll explore the top 10 AI tools that are revolutionizing the way we see and understand complex data relationships. Get ready to supercharge your analytical capabilities!
Introduction
In today’s data-driven world, making sense of complex information is more crucial than ever. Enter AI-powered graph visualization tools – the game-changers that are transforming raw data into intuitive, interactive visual representations. These cutting-edge solutions are not just about pretty pictures; they’re about uncovering hidden patterns, identifying key relationships, and making informed decisions faster than ever before.
Let’s dive into the top 10 AI tools that are setting the standard for dynamic graph visualization and discover how they can elevate your data analysis game.
Top 10 AI Tools for Graph Visualization
1. Neo4j Bloom: Bringing Graphs to Life
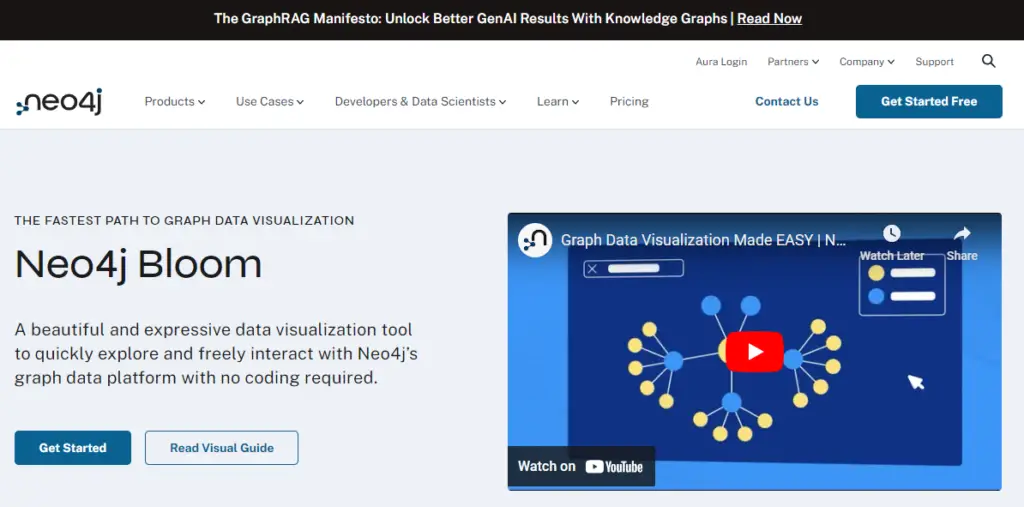
Neo4j Bloom is a powerhouse in the world of graph visualization. This AI-driven tool takes the complexity out of graph databases, allowing users to explore and interact with their data in real time. With its intuitive interface and powerful search capabilities, Bloom makes it easy to uncover insights that might otherwise remain hidden.
Key Features:
- Natural language search
- Interactive visualization
- Customizable styling
- Collaborative sharing
2. Gephi: The Swiss Army Knife of Network Analysis
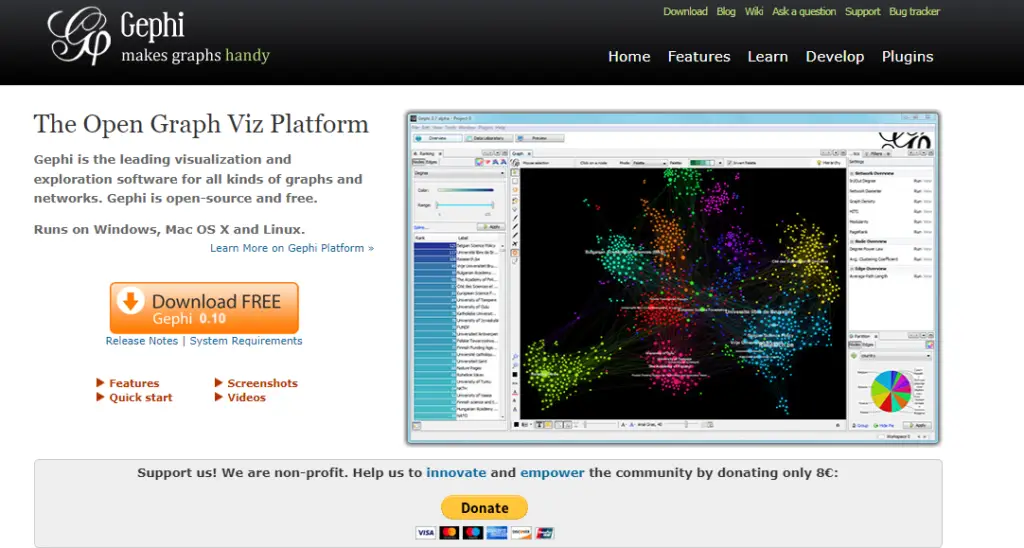
Gephi is an open-source platform that combines powerful analysis algorithms with flexible visualization capabilities. Its AI-enhanced features help users identify communities, influential nodes, and key patterns within complex networks.
Key Features:
- Real-time visualization
- Advanced filtering
- Powerful statistics
- Extensible plugin architecture
3. Graphistry: GPU-Accelerated Visual Analytics
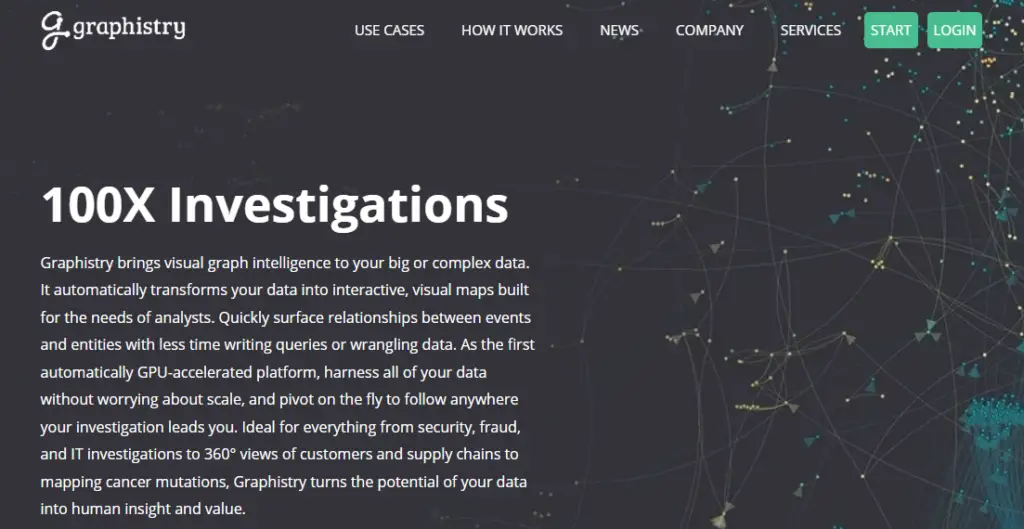
Graphistry takes graph visualization to the next level with its GPU-accelerated platform. By leveraging the power of AI and machine learning, Graphistry can handle massive datasets with ease, rendering complex graphs in stunning detail and at lightning-fast speeds.
Key Features:
- Scalable to billions of data points
- Interactive exploration
- Automated pattern detection
- Integration with popular data science tools
4. Linkurious: Intuitive Graph Intelligence

Linkurious combines the power of graph databases with an intuitive user interface, making it accessible to both technical and non-technical users. Its AI-driven features help analysts detect fraud, map criminal networks, and uncover hidden connections in financial data.
Key Features:
- User-friendly interface
- Advanced search and filtering
- Collaborative investigation
- Customizable visualizations
5. yWorks: The Graph Visualization Experts
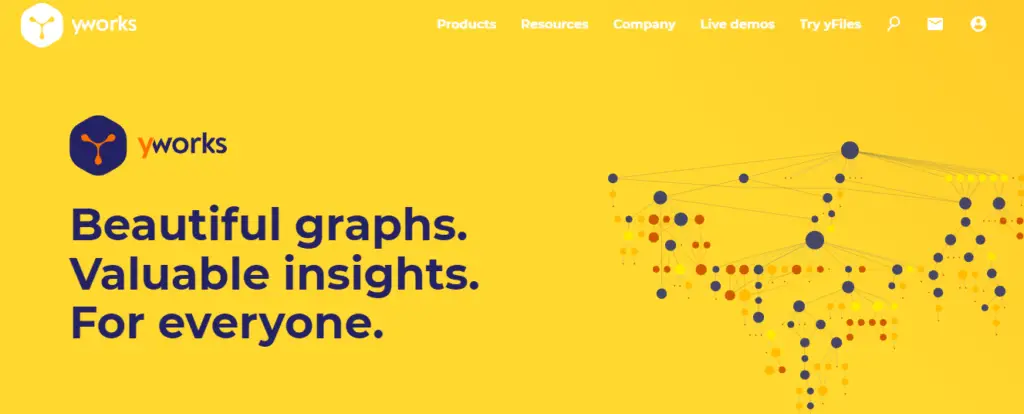
yWorks offers a suite of AI-enhanced tools for graph visualization and analysis. Their products, including yEd and yFiles, provide powerful layout algorithms and interactive features that make it easy to create beautiful, meaningful graph visualizations.
Key Features:
- Automatic layout algorithms
- Rich set of graph analysis tools
- Highly customizable
- Cross-platform compatibility
6. Cambridge Intelligence: Powering Visual Graph Analysis

Cambridge Intelligence’s KeyLines and ReGraph products leverage AI to provide flexible, scalable graph visualization solutions. These tools are designed to handle real-time data, making them ideal for cybersecurity, fraud detection, and intelligence analysis.
Key Features:
- Time-based analysis
- Geospatial mapping
- Customizable visual styles
- API-driven architecture
7. Graphin: Ant Group’s Open-Source Graph Innovation

Graphin, developed by Ant Group, is an open-source graph visualization toolkit that combines the power of G6 (a graph visualization engine) with React. Its AI-driven features make it easy to create interactive, customizable graph visualizations for a wide range of applications.
Key Features:
- Declarative API
- Extensible architecture
- Rich set of pre-built components
- Support for large-scale graphs
8. Cytoscape: The Biological Network Visualizer
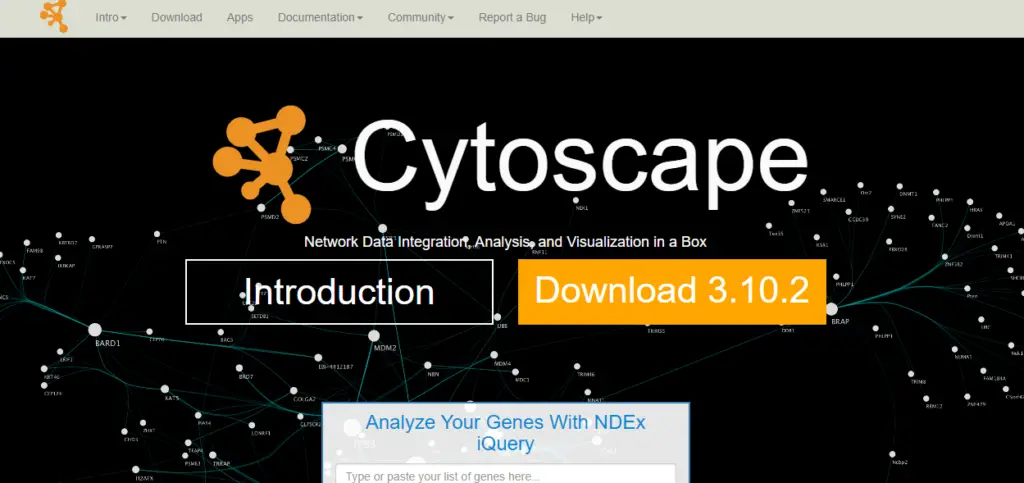
While originally designed for biological research, Cytoscape has evolved into a powerful, AI-enhanced tool for general network visualization and analysis. Its open-source nature and extensive plugin ecosystem make it a versatile choice for researchers and data scientists across various fields.
Key Features:
- Integrated network analytics
- Customizable visual styles
- Extensive plugin library
- Support for large networks
9. OmniSci (now Heavy.ai): Accelerated Analytics Platform

OmniSci’s platform combines GPU-accelerated analytics with powerful visualization capabilities, including graph visualization. By leveraging AI and machine learning, OmniSci enables users to explore and visualize massive datasets in real time.
Key Features:
- Extreme speed and scale
- Geospatial capabilities
- SQL and Python APIs
- Cross-filtering and interactive dashboards
10. Tom Sawyer Perspectives: Enterprise-Grade Graph Visualization
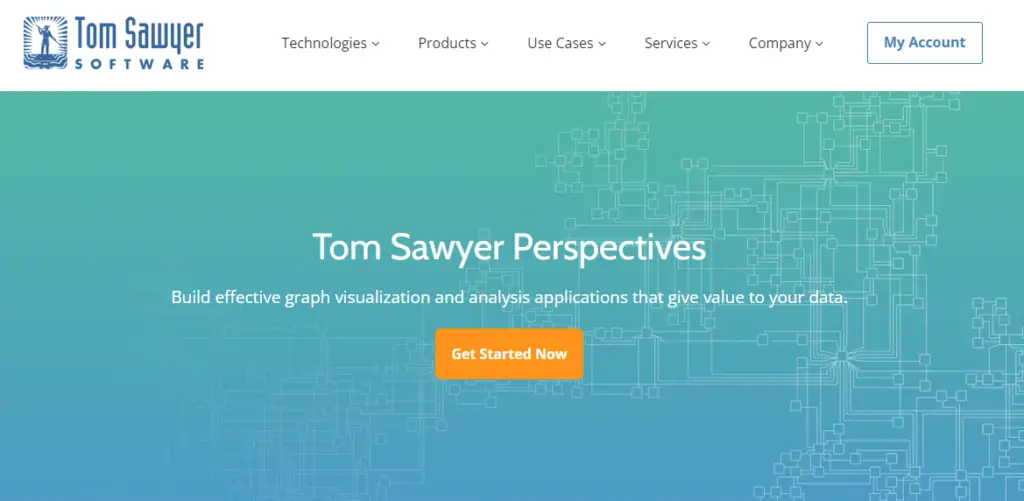
Tom Sawyer Perspectives is an enterprise-level graph and data visualization platform that incorporates AI-driven layout and analysis capabilities. It’s particularly well-suited for complex, hierarchical datasets in industries like telecommunications, transportation, and energy.
Key Features:
- Advanced layout algorithms
- Hierarchical visualization
- Integration with enterprise systems
- Customizable dashboards and reports
Comparison between the 10 AI tools for Dynamic Graph Visualization
Here’s a comparison table highlighting key features and use cases for the 10 AI tools for dynamic graph visualization:
| Tool | Key Features | Best For | Pricing | Ease of Use |
|---|---|---|---|---|
| Neo4j Bloom | – Natural language search – Interactive visualization – Customizable styling | – Database exploration – Pattern discovery | Commercial, contact for pricing | Moderate |
| Gephi | – Real-time visualization – Advanced filtering – Powerful statistics | – Network analysis – Academic research | Free, open-source | Moderate |
| Graphistry | – GPU-accelerated – Scalable to billions of datapoints – Automated pattern detection | – Big data visualization – Cybersecurity | Commercial, contact for pricing | Advanced |
| Linkurious | – User-friendly interface – Advanced search and filtering – Collaborative investigation | – Fraud detection – Financial analysis | Commercial, contact for pricing | Easy |
| yWorks | – Automatic layout algorithms – Rich set of analysis tools – Cross-platform compatibility | – Software engineering – Business process modeling | Commercial, various options | Moderate |
| Cambridge Intelligence | – Time-based analysis – Geospatial mapping – API-driven architecture | – Intelligence analysis – Cybersecurity | Commercial, contact for pricing | Advanced |
| Graphin | – Declarative API – Extensible architecture – Support for large-scale graphs | – Web-based applications – Custom visualizations | Free, open-source | Moderate |
| Cytoscape | – Integrated network analytics – Extensive plugin library – Customizable visual styles | – Biological research – Interdisciplinary studies | Free, open-source | Moderate |
| OmniSci (Heavyai) | – Extreme speed and scale – Geospatial capabilities – SQL and Python APIs | – Location intelligence – Telecom analytics | Commercial, contact for pricing | Advanced |
| Tom Sawyer Perspectives | – Advanced layout algorithms – Hierarchical visualization – Enterprise integration | – Telecommunications – Energy sector analysis | Commercial, contact for pricing | Advanced |
This table provides a quick overview of each tool’s strengths, ideal use cases, pricing model, and relative ease of use. It can help readers quickly compare the tools and identify which might be most suitable for their specific needs.
Conclusion
The world of AI-powered graph visualization is evolving rapidly, offering unprecedented opportunities to gain insights from complex data. Whether you’re a data scientist, business analyst, or researcher, these top 10 tools provide the capabilities you need to transform raw data into actionable intelligence.
By leveraging the power of AI, these tools not only make it easier to visualize and understand complex relationships but also uncover patterns and insights that might otherwise remain hidden. As we continue to generate more data, the importance of powerful, intuitive visualization tools will only grow.
So, which of these AI-powered graph visualization tools will you try first? Dive in, explore, and watch as your data comes to life in ways you never imagined possible
Also Read from iLovePhD:
- Top 7 Artificial Intelligence (AI) Tools in Scientific Research 2024
- 10 Mind-Blowing AI Projects Transforming Medical Imaging
- 150+ Innovative Generative AI Project Ideas: Transforming Industries and Advancing Technology
Source List:
Here’s a source list for the Top 10 AI Tools for Graph Visualization in the World 2024
- Neo4j Bloom
- Gephi
- Graphistry
- Linkurious
- yWorks
- Cambridge Intelligence
- Graphin by Ant Group
- Cytoscape
- OmniSci (now Heavyai)
- Tom Sawyer Perspectives
Additional sources for general information on graph visualization and AI:
- A Survey of Graph Visualization Techniques
- A Comprehensive Survey on Graph Neural Networks
- Graph Theory and Deep Learning: Know-Hows
