Research data are numerical or character information that is collected through the observation. The best visualization of data helps researchers to understand what is happening to why it’s happening. We can achieve this with five easy steps. In this article, ilovephd provides five easy steps to tell a story with your research data.
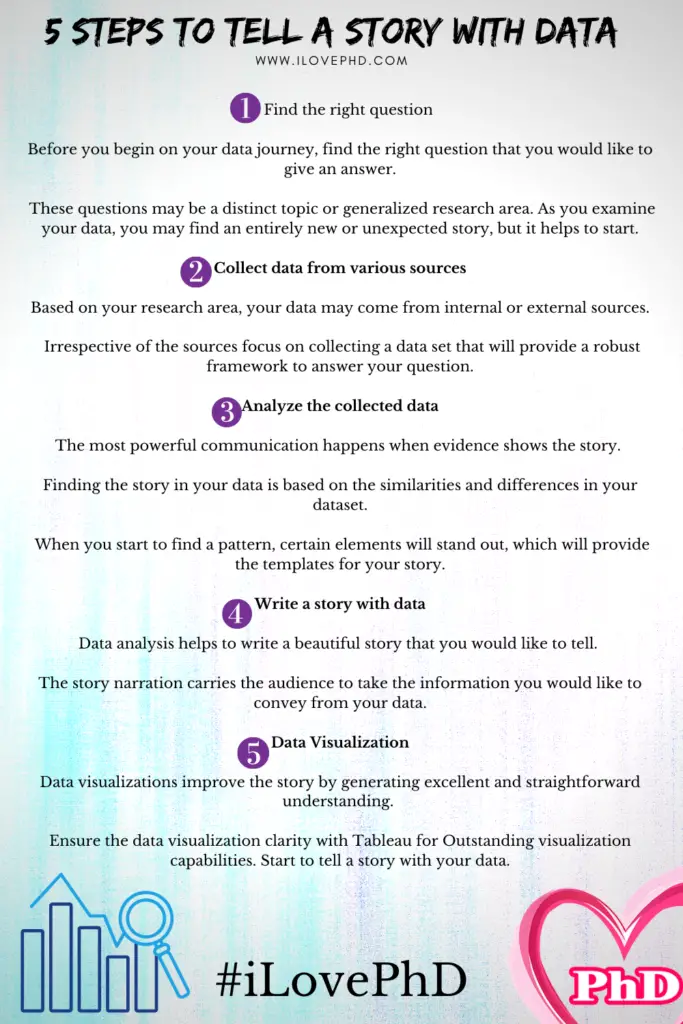
1. Find the right question
Before you begin on your data journey, find the right question that you would like to give an answer. These questions may be a distinct topic or generalized research area. As you examine your data, you may find an entirely new or unexpected story, but it helps to start.
2.Collect data from various sources
Based on your research area, your data may come from internal or external sources. Irrespective of the sources focus on collecting a data set that will provide a robust framework to answer your question.
3.Analyze the collected data
The most powerful communication happens when evidence shows the story. Finding the story in your data is based on the similarities and differences in your dataset. When you start to find a pattern, certain elements will stand out, which will provide the templates for your story.
4. Write a story with data
Data analysis helps to write a beautiful story that you would like to tell. The story narration carries the audience to take the information you would like to convey from your data.
5.Data Visualization
Data visualizations improve the story by generating excellent and straightforward understanding. Ensure the data visualization clarity with Tableau for Outstanding visualization capabilities. Start to tell a story with your data.
Read more about Tableau software:
Tableau’s Key Features for Business Intelligence and Data visualization
What is Tableau?
- Tableau is a Business Intelligence(BI) software that helps people see and understand their data(data visualization).
Key Features:
- Can create almost all kinds of BI requirements.
- Good career opportunities.
- Easy to learn.
- Modern age look and feel.
Types of Tableau:
- Tableau Desktop: Made for individual use
- Tableau Server: Collaboration for any organization
- Tableau Online: Business Intelligence in the Cloud
- Tableau Reader: Let you read files saved in Tableau Desktop
- Tableau Public: For journalists or anyone to publish interactive data online
Fast Analytics
- Connect and visualize your data in minutes.
- Tableau is 10 to 100x faster than existing solutions.
Big Data, Any Data
- From spreadsheets to databases to Hadoop to cloud services, explore any data.
Smart Dashboards
- Combine multiple views of data to get richer insight.
- Best practices of data visualization are baked right in.
Update Automatically
- Get the freshest data with a live connection to your data or get automatic updates on a schedule you define.
Share in Seconds
- Publish a dashboard with a few clicks to share it live on the web and on mobile devices.
Ease of Use
- Anyone can analyze data with intuitive drag & drop products. No programming, just insight.


