In the fast-paced world of academic publishing, researchers are constantly seeking ways to make their work stand out. Enter the graphical abstract – a powerful visual tool that can capture the essence of your research at a glance. This article will dive deep into the world of graphical abstract, exploring what they are, why they matter, and how you can create one that truly shines.
What is a Graphical Abstract?
A graphical abstract is a simple, concise, and self-explanatory figure that elucidates the scientific data or the main research findings in a pictorial form. This article explains how to create a graphical abstract with simple steps.
It represents the important findings of a research or review paper in a nutshell, which helps the readers to understand the main take-home message at a single glance.
It allows the reader to grasp their attention, to identify more suitable research articles relevant to their research, and to conduct interdisciplinary research.
Why Graphical Abstract Matter?
In today’s digital age, where information overload is the norm, graphical abstracts have become increasingly important. Here’s why:
- Increased Visibility: Many journals now feature graphical abstracts on their tables of contents, making your work more likely to catch a reader’s eye.
- Quick Understanding: Researchers can quickly grasp the main points of your study without reading the entire abstract or paper.
- Social Media Sharing: Graphical abstracts are perfect for sharing on platforms like Twitter, increasing the reach of your research.
- Cross-Disciplinary Appeal: Visual representations can make your work more accessible to researchers outside your specific field.
- Memory Retention: Studies have shown that people remember visual information better than text alone.
“A typical graphical abstract should attract the reader’s attention whether to read your full paper or not. If this is achieved, the purpose of your graphical abstract is fulfilled”.
Crafting the Perfect Graphical Abstract: A Comprehensive Guide for Researchers in 2025
Steps to create a graphical abstract
The main purpose of a graphical abstract is to influence the reader’s curiosity, to present the research outcome briefly, and to summarize the findings. The basic steps to create an effective pictorial abstract include:

The first two steps are based on paperwork and the third step requires graphic design software. A logical concept is very important to carry out any research. So, one should decide what is the important message to be delivered through a graphical abstract and to whom it is to be conveyed. Therefore, the picture abstract is defined by the concept and the readers.
The second step is to sketch the appropriate visual elements (chemical structure, biological components, mechanical parts, etc.) that portray the research outcome directly and precisely.
Arrange the elements of the sketch in a right sequence either from left to right or top to down to get a meaningful abstract. Ensure that all the elements are connected, and arranged into groups that have something in common.
The final step is to design the sketch using graphic design software (Photoshop) or simple PowerPoint. Ensure that all the elements are illustrated with a uniform art style, otherwise, it may look bizarre.
Too many results or conclusions will complicate the visual representation of the abstract. One should think from the reader’s point of view and summarize the most important and specific results simply.
Criteria for an ideal graphical abstract:
- A graphical abstract should be unique, clear, simple, and self-explanatory.
- It should highlight the novel findings of the research without reproducing the results reported in the published literature.
- It should be different from the diagrams/figures illustrated in the article itself.
- It should not include data items, the results should be in a pictorial form.
- It should not include true facts, proven science, and existing results.
Different styles of formatting:
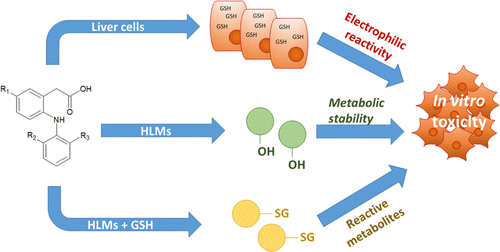
Diagram style graphical abstract:
This type of graphical abstract is widely used in the field of chemistry to represent chemical reactions, structure, bonding, etc. This is considered the easiest and simplest method to explain the technical findings. This style uses highly technical language and abbreviations with no background context.
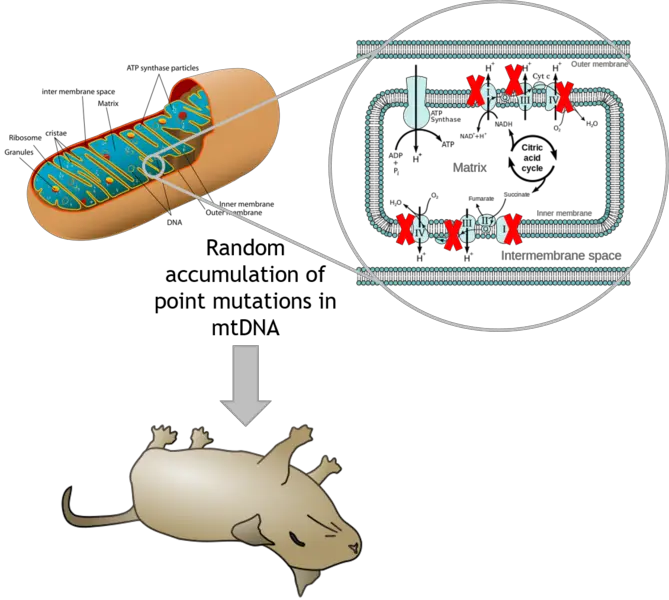
Visual style:
Graphical abstract developed by visual style is more professional than diagram style and can be made quickly and easily using PowerPoint. This type of style is frequently used in medical-related journals.
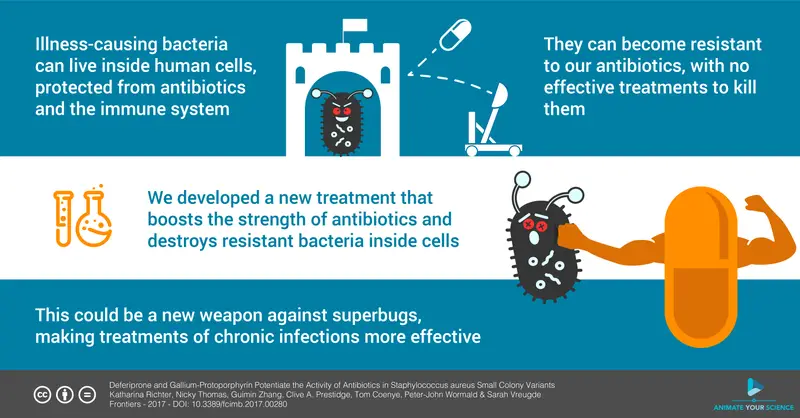
Infographic style:
This is the advanced style that tends to use both text and graphics in a more visually attractive way. The infographic-based image abstracts are developed using design software, which looks more professional and gains the reader’s attention easily.
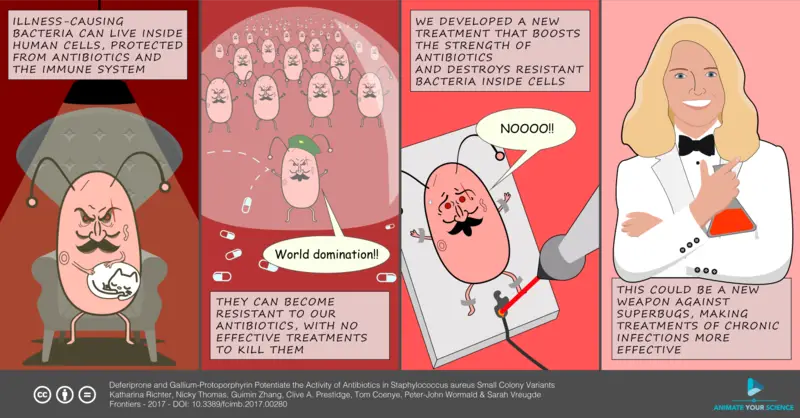
Comic style:
Comic style of the abstract uses cartoon characters to express the research findings humorously. Therefore, this style helps to cover the maximum number of readers.
According to Elsevier, the technical specifications required to prepare an image abstract is listed below:
- Image size: The image should be 531 X 1328 pixels with a resolution of 300 dpi.
- File type: TIFF, EPS, PDF
- Font: Times, Arial, Courier or Symbol with large font size.
- Any text or label should be part of the image file. The abstract should be one image file.
Creating Your Graphical Abstract: A Simple Step-by-Step Guide
Now that we understand the importance of graphical abstracts, let’s dive into how to create one that truly stands out.
1. Identify Your Key Message
Before you start designing, ask yourself: “What’s the one thing I want readers to remember about my research?” This central message will be the foundation of your graphical abstract.
2. Sketch Your Initial Ideas
Don’t jump straight to the computer. Start with pen and paper, sketching out different ways to represent your key message visually. This brainstorming phase is crucial for generating creative ideas.
3. Choose Your Visual Elements
Decide which elements will best convey your message. These might include:
- Diagrams
- Graphs
- Icons
- Illustrations
- Flowcharts
- Photos
Remember, less is often more. Aim for clarity over complexity.
4. Consider Color Psychology
Colors can evoke emotions and enhance understanding. Choose a color palette that complements your message. For example:
- Blue: Trust, stability
- Green: Growth, nature
- Red: Energy, urgency
- Yellow: Optimism, creativity
Be mindful of color-blind readers and ensure your design works in grayscale too.
5. Incorporate Text Strategically
While the focus should be on visuals, some text is often necessary. Keep it brief and impactful. Use easy-to-read fonts and consider hierarchy – make the most important information stand out.
6. Ensure Scalability
Your graphical abstract may be viewed on various devices, from smartphones to large monitors. Design with scalability in mind, ensuring that all elements are clear at different sizes.
7. Use Design Software
While tools like PowerPoint can work in a pinch, professional design software can take your graphical abstract to the next level. Options include:
- Adobe Illustrator
- Canva
- BioRender (specifically for scientific illustrations)
- Inkscape (free, open-source alternative)
8. Get Feedback
Before finalizing your design, share it with colleagues. Fresh eyes can spot areas for improvement and ensure your message is clear to others in your field.
9. Refine and Polish
Based on feedback, refine your design. Pay attention to details like alignment, spacing, and overall composition. A polished look adds credibility to your research.
10. Check Journal Guidelines
Different journals may have specific requirements for graphical abstracts. Always check the submission guidelines and adjust your design accordingly.
Best Practices for Effective Graphical Abstracts
To ensure your graphical abstract truly shines, keep these best practices in mind:
- Keep It Simple: Avoid cluttering your design with too much information. Focus on the core message.
- Use Visual Hierarchy: Guide the viewer’s eye through your abstract with size, color, and placement of elements.
- Be Consistent: Use a consistent style throughout your abstract for a cohesive look.
- Tell a Story: Structure your abstract to lead the viewer through your research narrative.
- Make It Stand Alone: Your graphical abstract should be understandable without reference to the main text.
- Consider Accessibility: Ensure your design is accessible to color-blind individuals and works well in black and white.
Common Pitfalls to Avoid
Even experienced researchers can fall into these traps when creating graphical abstracts:
- Overcomplication: Trying to include too much information can make your abstract confusing.
- Poor Resolution: Using low-quality images or graphics can make your work look unprofessional.
- Ignoring Branding: If applicable, consider incorporating your institution’s branding guidelines.
- Copyright Infringement: Always use original artwork or properly licensed images.
- Neglecting the Target Audience: Keep your intended readers in mind throughout the design process.
The Future of Graphical Abstracts
As scientific communication continues to evolve, so too will graphical abstracts. We’re already seeing trends towards interactive and animated graphical abstracts, particularly in online publications. Staying ahead of these trends can help your research stand out even more.
Conclusion
Crafting an effective graphical abstract is both an art and a science. By following the steps and best practices outlined in this guide, you’ll be well on your way to creating visuals that not only accurately represent your research but also capture the attention of readers in an increasingly crowded scientific landscape. Remember, a well-designed graphical abstract can be the key to getting your work noticed and remembered in the competitive world of academic publishing.
Hope this article helps you to know about the graphical abstract and its types.
You may also love to read
How to Become an Academic Journal Reviewer?| Step-by-Step Guide
Download Free Mendeley Datasets?
How to Get Published in High-Impact Journals?
External Authoritative Sources:
- Nature’s guide to making graphical abstracts:
- Elsevier’s tips for creating effective graphical abstracts:
- American Chemical Society’s guidelines for graphical abstracts:
- A study on the effectiveness of graphical abstracts:
- A study on the effectiveness of graphical abstracts:

[…] to submit a graphical abstract. The procedure to create a graphical abstract can be found in HOW TO CREATE GRAPHICAL ABSTRACT […]